In March 2020, the gold-to-silver ratio briefly exceeded 120:1 , the highest level in modern history. For every ounce of gold, you could buy 120 ounces of silver. A year later, the ratio had collapsed to 65:1, with silver outperforming gold by more than 70%. That single statistic captures the most important thing to understand about these two metals: they look like cousins, but they trade like very different animals.
Gold and silver have served as stores of value for thousands of years. But despite both being classified as precious metals, they offer distinctly different investment characteristics , different volatility, different demand drivers, different roles within a portfolio. Choosing between them, or deciding how to weight each, comes down to understanding what each metal actually does in real market conditions.
The Fundamental Differences Between Gold and Silver
While gold and silver share many characteristics as precious metals, their fundamental properties create distinct investment profiles.
Scarcity and production. Gold is significantly rarer than silver in the Earth’s crust. Approximately 3,000 to 3,500 metric tons of gold are mined annually worldwide, compared to roughly 25,000 to 27,000 metric tons of silver. This difference in abundance has historically contributed to gold’s higher per-ounce value.
Physical properties. Silver possesses unique physical characteristics that distinguish it from gold. It has the highest electrical conductivity of any metal, the highest thermal conductivity, and exceptional reflectivity. These properties make silver indispensable in numerous industrial applications, from electronics to solar panels. Gold, while also used industrially, is primarily valued for its resistance to corrosion, malleability, and aesthetic appeal.
Storage considerations. Due to silver’s lower price per ounce, investors holding equivalent dollar amounts face very different storage challenges. A given dollar amount of silver typically weighs 50-80 times more than the equivalent in gold. This dramatically impacts storage costs, transportation, and practical handling for physical metal investors.
Market size and liquidity. The gold market is substantially larger than the silver market. According to World Gold Council data, the total above-ground gold stock is valued in the trillions of dollars, while silver’s total above-ground stock represents a much smaller market. This size differential means silver markets can experience greater volatility, as smaller capital flows can move prices more dramatically.
The Gold-Silver Ratio: A Historical Perspective
The gold-silver ratio , calculated by dividing the gold price by the silver price , has been used for centuries to compare the relative value of these metals.
Ancient history. In ancient Egypt around 3000 BCE, the gold-silver ratio was approximately 2.5:1. The Roman Empire maintained an official ratio of 12:1. For much of recorded history, the ratio fluctuated between 10:1 and 16:1, influenced by mining discoveries, monetary policies, and trade patterns.
The U.S. Coinage Act of 1792. When the United States established its monetary system, the Coinage Act fixed the gold-silver ratio at 15:1. Market forces often pushed actual trading ratios away from this fixed standard, creating arbitrage opportunities for centuries.
20th-century fluctuations. The ratio experienced dramatic swings throughout the 1900s. In 1980, when the Hunt brothers attempted to corner the silver market, the ratio fell to approximately 17:1 as silver prices spiked to nearly $50 per ounce. During periods of economic stability, the ratio often expanded to 50:1 or higher.
Recent history. In March 2020, amid pandemic-related market turmoil, the gold-silver ratio briefly exceeded 120:1 , the highest level in modern history. This extreme reading indicated silver was historically undervalued relative to gold. By early 2021, the ratio had contracted to approximately 65:1 as silver prices recovered more aggressively than gold.
Interpreting the ratio. Many precious metals analysts consider ratios above 80:1 to suggest silver is relatively undervalued compared to gold, while ratios below 50:1 may indicate silver is relatively overvalued. The ratio should be considered alongside other market factors rather than as a standalone trading signal. The long-term average over the past century has hovered around 55:1 to 60:1.
The Silver Institute supply and demand data remains the authoritative annual source for tracking industrial silver consumption across solar, electronics, automotive, and medical applications.
Industrial Demand: Silver’s Dual Role
One of the most significant differences between gold and silver lies in their industrial applications , a distinction that fundamentally affects how each metal responds to economic conditions.
Silver’s industrial consumption. Approximately 50-55% of annual silver demand comes from industrial applications. Key sectors include:
- Electronics , silver’s unmatched electrical conductivity makes it essential in smartphones, computers, tablets, and EVs. A typical electric vehicle contains nearly triple the silver of a gasoline car.
- Solar energy , photovoltaic cells rely heavily on silver paste. A single solar panel typically contains 6-7 grams of silver. (We covered this in more detail in our analysis of silver industrial demand from solar, EVs, and electronics.)
- Medical applications , silver’s antimicrobial properties make it valuable in wound dressings, medical equipment coatings, and water purification systems.
- Brazing and soldering , silver alloys are used extensively in joining metals across automotive, aerospace, and HVAC industries.
Gold’s limited industrial use. Only about 7-10% of annual gold demand comes from industrial applications, primarily in electronics (where gold’s corrosion resistance is valued for connectors) and dentistry. The vast majority of gold demand , approximately 50% , comes from jewelry, with investment demand accounting for most of the remainder.
Economic sensitivity. This difference in demand composition means silver prices are more sensitive to economic cycles. During industrial expansions, silver often outperforms gold as manufacturing demand increases. During recessions, reduced industrial activity can weigh on silver prices even as investors seek safe-haven assets. Gold’s minimal industrial exposure means its price movements are more purely driven by investment sentiment, currency fluctuations, and monetary policy , themes we explored in our piece on why gold rises when the dollar falls.
Price Volatility and Performance Characteristics
Understanding how gold and silver prices behave differently is crucial for investors setting position sizes and expectations.
Volatility comparison. Silver consistently demonstrates higher price volatility than gold. Historically, silver’s price movements have been roughly 1.5 to 2 times more volatile than gold’s on a percentage basis. This means silver can deliver larger percentage gains during bull markets but also steeper losses during corrections.
Historical performance examples. During the 2008-2011 precious metals bull market, gold rose from approximately $700 per ounce (October 2008) to $1,900 per ounce (September 2011) , a gain of roughly 171%. Silver rose from approximately $9 per ounce to $48 per ounce during the same period , a gain of roughly 433%.
During the subsequent correction (2011-2015), gold declined from $1,900 to approximately $1,050 , a loss of roughly 45%. Silver declined from $48 to approximately $14 , a loss of roughly 71%.
This pattern , silver outperforming gold during rallies and underperforming during declines , has repeated throughout history. Investors often describe silver as “gold on steroids” due to these amplified movements.
Correlation patterns. Gold and silver prices are highly correlated over long periods, typically showing correlation coefficients above 0.85 over multi-year timeframes. But short-term correlations can diverge significantly, particularly during periods of industrial demand shifts or precious metals-specific market events.
For benchmark pricing across both metals, the LBMA precious metal prices serve as the global reference, with twice-daily auctions establishing the spot prices that dealers, refiners, and institutional buyers use as their baseline.
Investment Vehicles: Ways to Own Gold and Silver
Investors can gain exposure to gold and silver through several vehicles, each with distinct tradeoffs.
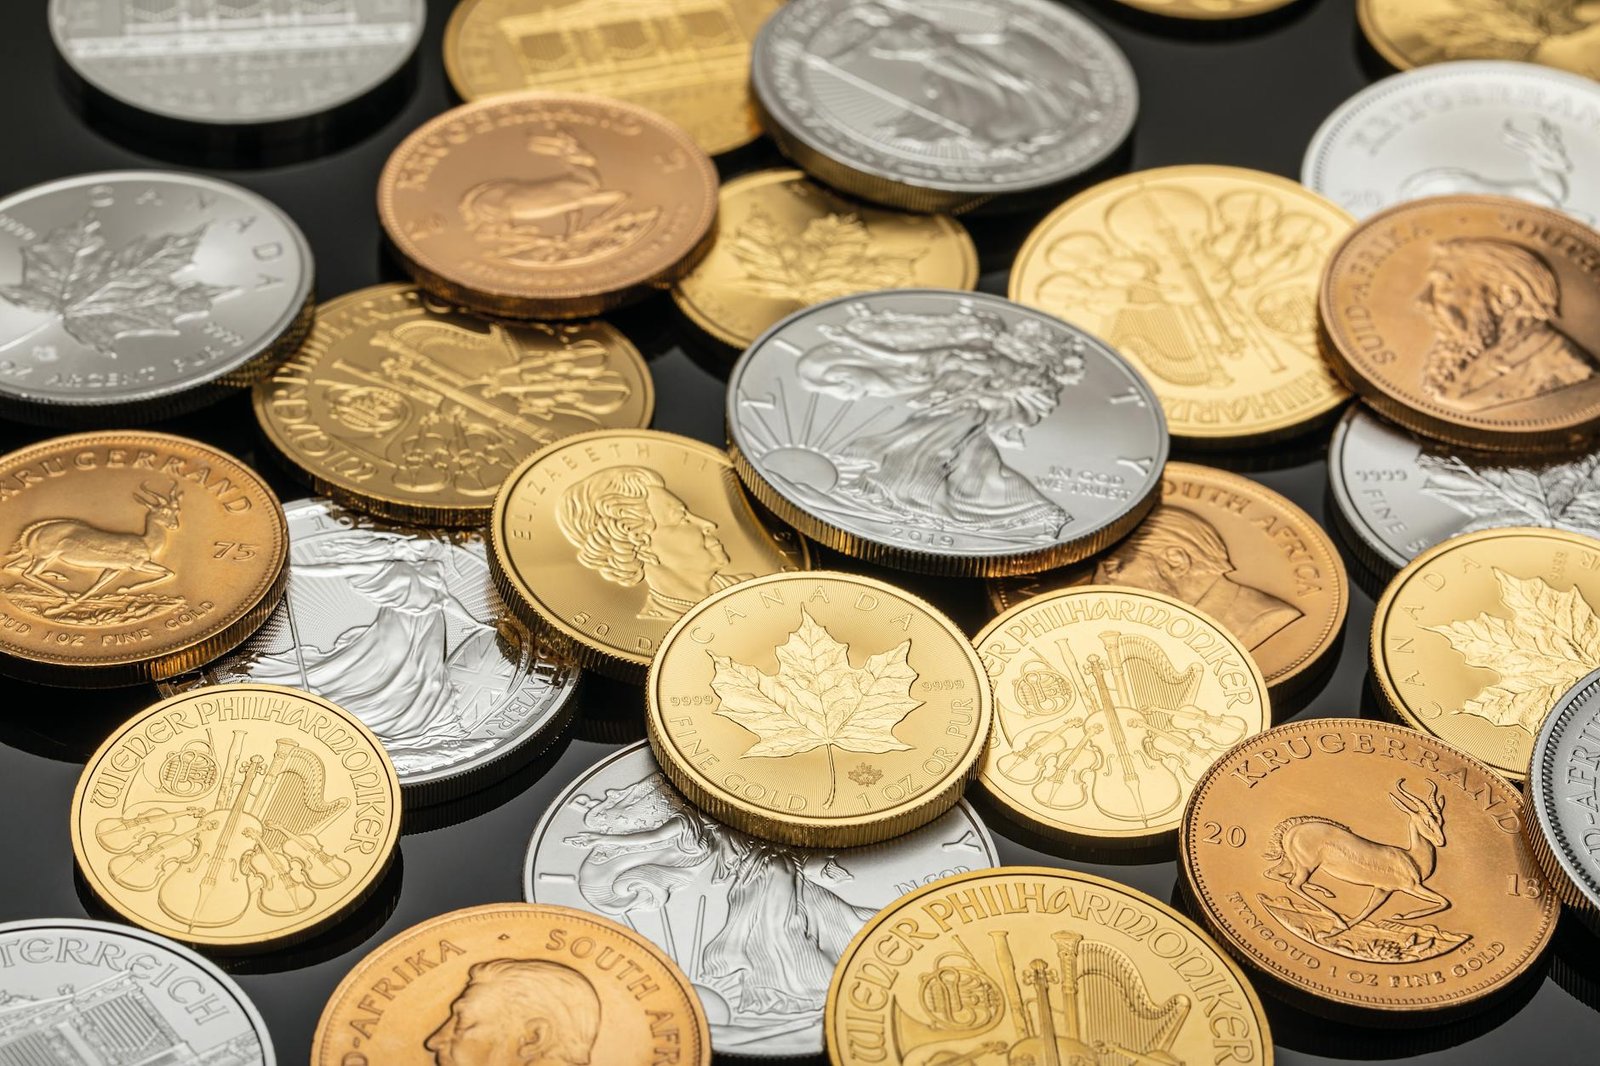
Physical bullion. Government-minted coins like American Eagles, Canadian Maple Leafs, and Austrian Philharmonics offer recognizable, liquid options for both metals. Premiums above spot typically range from 3-10% for gold and 10-25% for silver. Bars carry lower premiums but may be less liquid in smaller transactions. Physical ownership requires secure storage and insurance.
Exchange-traded funds (ETFs). Gold ETFs such as SPDR Gold Shares (GLD) and iShares Gold Trust (IAU) hold physical gold bullion and trade on major exchanges. Silver ETFs like iShares Silver Trust (SLV) and Aberdeen Standard Physical Silver Shares ETF (SIVR) offer similar exposure to silver. ETFs provide convenience and liquidity but involve management fees (typically 0.15-0.50% annually) and don’t offer tangible ownership.
Mining stocks and ETFs. Shares in gold and silver mining companies offer leveraged exposure to metal prices but introduce company-specific risks: management quality, reserve life, production costs, and geopolitical factors. Mining ETFs like VanEck Gold Miners ETF (GDX) and Global X Silver Miners ETF (SIL) provide diversified exposure across multiple companies.
Futures and options. Standardized futures contracts trade on exchanges like COMEX, offering leverage and the ability to take both long and short positions. These are typically more suitable for experienced investors due to their complexity, margin requirements, and potential for significant losses.
Central Bank Activity and Institutional Demand
The role of central banks and institutional investors differs markedly between gold and silver markets.
Central bank gold holdings. Central banks collectively hold approximately 35,000 metric tons of gold , roughly 17% of all gold ever mined. Major holders include the United States (approximately 8,133 tons), Germany (approximately 3,355 tons), Italy (approximately 2,452 tons), and France (approximately 2,437 tons). Since 2010, central banks have been net buyers of gold, adding legitimacy to gold’s role as a monetary reserve asset. (For a deeper look, see our piece on how central banks move gold markets.)
Silver’s absence from central bank reserves. Central banks do not hold silver as a monetary reserve, and they ceased such holdings decades ago. This absence removes a significant source of institutional demand that supports gold prices.
Investment fund holdings. Institutional investors, pension funds, and sovereign wealth funds typically favor gold over silver when allocating to precious metals. Gold’s larger market size, deeper liquidity, and established role in portfolio construction make it more accessible for institutions deploying large capital amounts.
What This Means for Investors
The distinctions between gold and silver create different potential roles within investment portfolios.
Portfolio allocation. Gold’s lower volatility and larger market size may make it more suitable as a core precious metals holding for conservative investors focused on wealth preservation. Silver’s higher volatility may appeal to investors seeking greater upside potential who can tolerate larger drawdowns. Many investors hold both , gold for stability, silver for amplified upside.
Economic cycle positioning. During economic expansions, silver’s industrial demand component may provide additional support beyond investment demand. During contractions, gold’s purer safe-haven status may offer more reliable portfolio protection. The gold-silver ratio can provide context for relative value, though it should not be used in isolation.
Practical considerations. Storage costs favor gold for large allocations due to its higher value density. Silver’s higher premiums and wider bid-ask spreads increase transaction costs. Tax treatment may vary by jurisdiction and investment vehicle.
What to Watch Next
For investors actively tracking the gold-silver relationship, several specific signals are worth monitoring:
- The gold-silver ratio , sustained moves above 80:1 historically signal silver is undervalued relative to gold; moves below 50:1 suggest the opposite
- Silver ETF flows , large inflows or outflows from SLV and SIVR are a real-time gauge of silver investment sentiment
- Solar installation data , Chinese and Indian solar capacity additions directly impact industrial silver demand
- Central bank gold purchase announcements , quarterly data from the World Gold Council shows whether institutional gold demand is accelerating
- Mining production reports , major silver miners’ output guidance signals supply-side dynamics that don’t affect gold in the same way
Neither metal is inherently superior as an investment , their suitability depends entirely on individual circumstances, risk tolerance, investment timeframes, and portfolio objectives. Understanding the fundamental differences between them is the foundation for thoughtful precious metals allocation decisions, whether you choose to hold one, the other, or both.